
Seferi Reporting
It photographs the period and tells you what to do today
- Margin
- Not revenue but efficiency — busy-but-poor shows up
- Action list
- Every money-losing situation spelled out
- Excel
- Export in exactly the layout you see on screen
Some of the brands that trust us





- and more
The module from start to finish
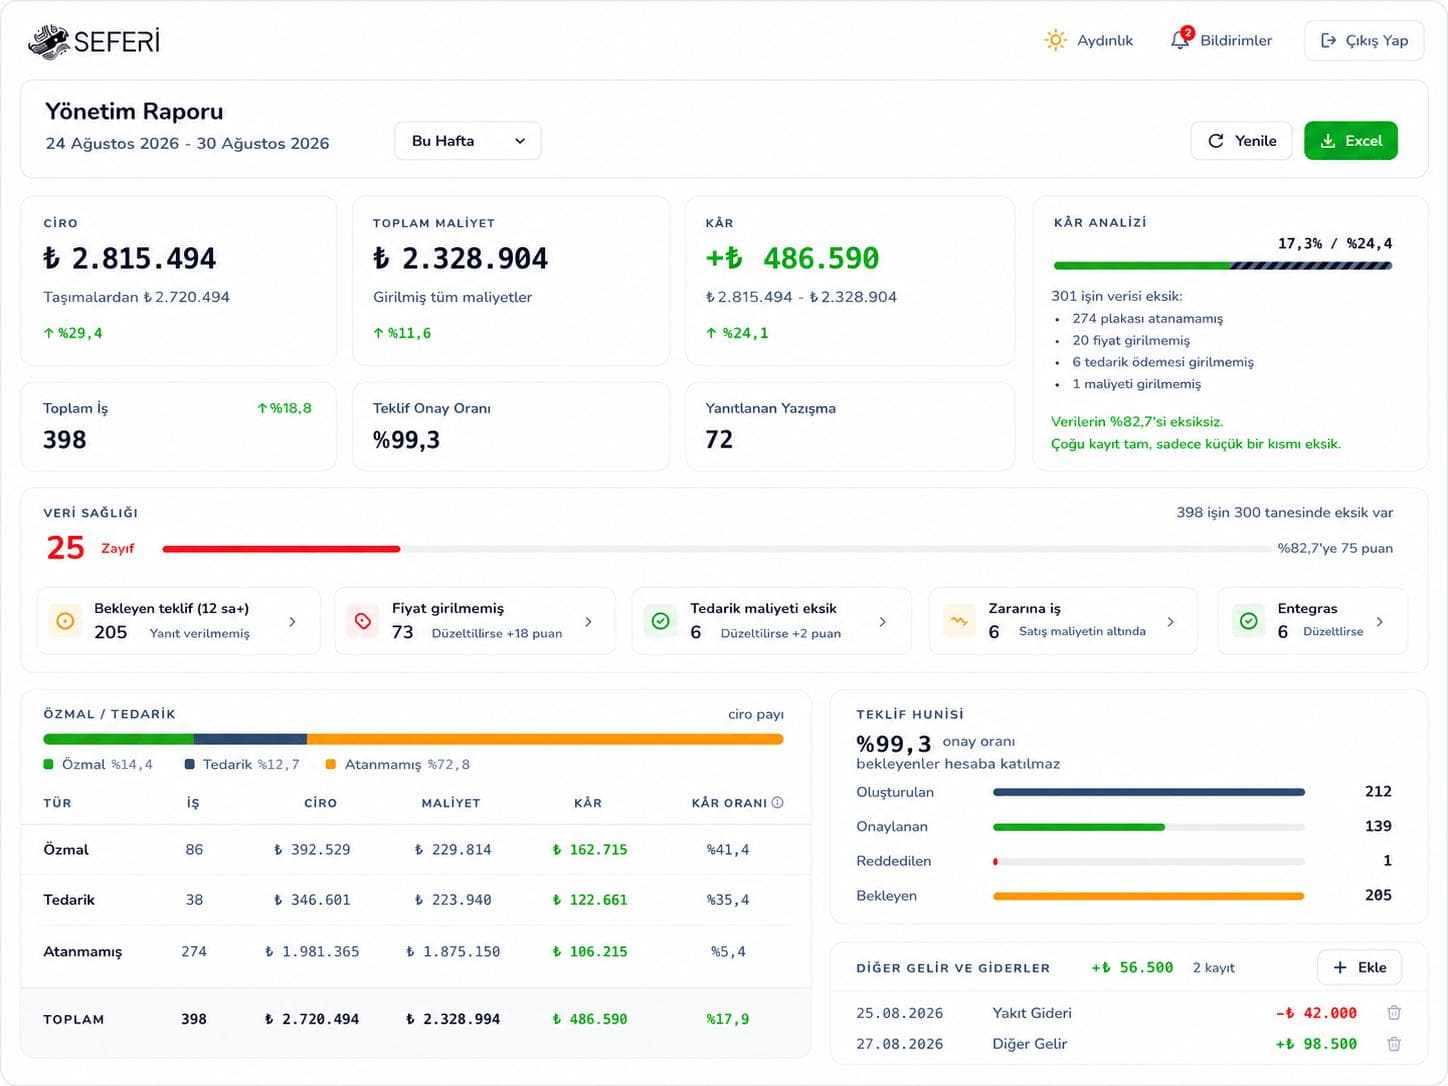
Most reporting screens are somewhere you visit once the month has closed. Seferi's report screen does two jobs at once: it shows the period's revenue, cost and profit, and next to that it lists the problems sitting in front of you right now.
Product screen
Things needing action
The system looks for what is losing money or about to: a quote pending more than 12 hours, a job with no vehicle assigned, a job with no price or no cost entered, a sales price mistyped as 0, a record that never reached accounting. If there is none of it, the screen says so too.
How the work flows
Margin is efficiency, not revenue
The performance board ranks by person or by vehicle, and numeric columns start from the highest. Rows with no data sink to the bottom — a cell showing "—" does not sort like a zero and land next to someone genuinely underperforming.
- 1
Order, cost and quote data come together
- 2
Period cards are calculated
- 3
Things needing action are listed
- 4
You drop from a number into the order list
Panels on the screen
You can get behind the number
Click a card and you drop into the order list behind it. If a job stayed out of the profit calculation, the reason is shown separately for each; the breakdown adds up exactly to the out-of-scope count.
ReportingInstead of hunting for "why was profit low?" at month-end, you close the problem on the day it appears.
What's on the screen
The real names of the panels inside the product, and what each one shows.
- Money Cards
- Period revenue, total cost, profit/loss — and next to them an honest line: the count of jobs left out of the profit figure.
- Operations Strip
- Total jobs, threads answered and the quote approval rate.
- Quote Funnel
- Created, pending, approved, rejected.
- Performance Board
- "Who shall we look at?" — profit/loss, margin and conversion, by person or by vehicle.
- Things Needing Action
- Quotes pending 12h+, no vehicle assigned, no price or cost entered, sold below cost, failed to write to the integration.
- Ownership Breakdown
- Own fleet, subcontracted and unassigned jobs separated, with which of them counts towards profit written down.
- Order Status
- The period's orders with status, pickup point, plate, weight and price.
- Manual Entries
- Income and costs entered by hand — warehouse rent and the like — tracked separately.
What does this module take over?
On the left how it runs today, on the right how it runs in Seferi.
The report is opened after the month closes; by the time a problem is spotted it is history.
The action list puts money-losing situations in front of you on the day they appear: a pending quote, a job with no vehicle assigned, a job with no price entered.
"That many jobs stayed out of the profit figure" — but nobody knows which, or why.
Each job falls into exactly one reason and that reason is written down: no vehicle, no price, no supplier payment entered.
Bonus and target conversations run on a floor where everyone is looking at a different table.
The salesperson sees their own conversion rate and the planner sees the margin on their own vehicles, on the same screen.
Used in the daily work
Every item maps to a screen inside the product — none of it is a roadmap.
- Money cards: period revenue, total cost, profit/loss and the count of jobs left out of the calculation
- Quote funnel: created, pending, approved, rejected
- Performance board — ranked by person or by vehicle
- A margin column that shows efficiency rather than revenue
- Click a card and drop into the order list behind it
- Each job's reason for not entering the profit calculation, spelled out one by one
- Excel export in exactly the layout on screen
Who uses it
The same module does not open the same screen for everyone on the team.
Manager
Starts at the money cards and reads off the action list which gap to close.
Sales
Sees their own conversion rate on the performance board.
Accounting
Closes the reasons jobs stayed out of the profit figure, one by one, and exports the same screen to Excel.
Once this module is switched on
In the demo you see these on your own data.
A problem shows up on the day it appears, not at month-end.
The manager knows which gap to close.
Bonus and target conversations sit on one screen everyone shares.
What gets asked most before a demo
Can I get behind the number?
Yes. Click a card and you drop into the order list behind it; no number stays a closed box.
Why would a job stay out of the profit figure?
No vehicle, no price, no cost, or no supplier payment entered. Each job falls into exactly one reason, and the breakdown adds up exactly to the out-of-scope count.
What do I see when the action list is empty?
The screen says that too: "Perfect."
Which KPIs should a freight operation track?
The Reporting screen shows profit margin (efficiency, not revenue), quote approval/rejection rate, and the count of jobs losing money directly. Alongside those, empty-kilometre rate and profit per vehicle are the other core signals of operational health — we cover both in separate blog posts.
See Reporting running on your own operation
The demo is not a slide deck; it is a session that runs on your own data.
- 01
A 30-minute call
We listen to your operation: how many vehicles, which lanes, which step is still done by hand today.
- 02
A run on your own data
We read a real request from your own inbox and turn it into a quote; you see your own lanes on screen.
- 03
A rollout plan
Which module goes live on day one, what gets migrated, and the per-vehicle price — in writing.