

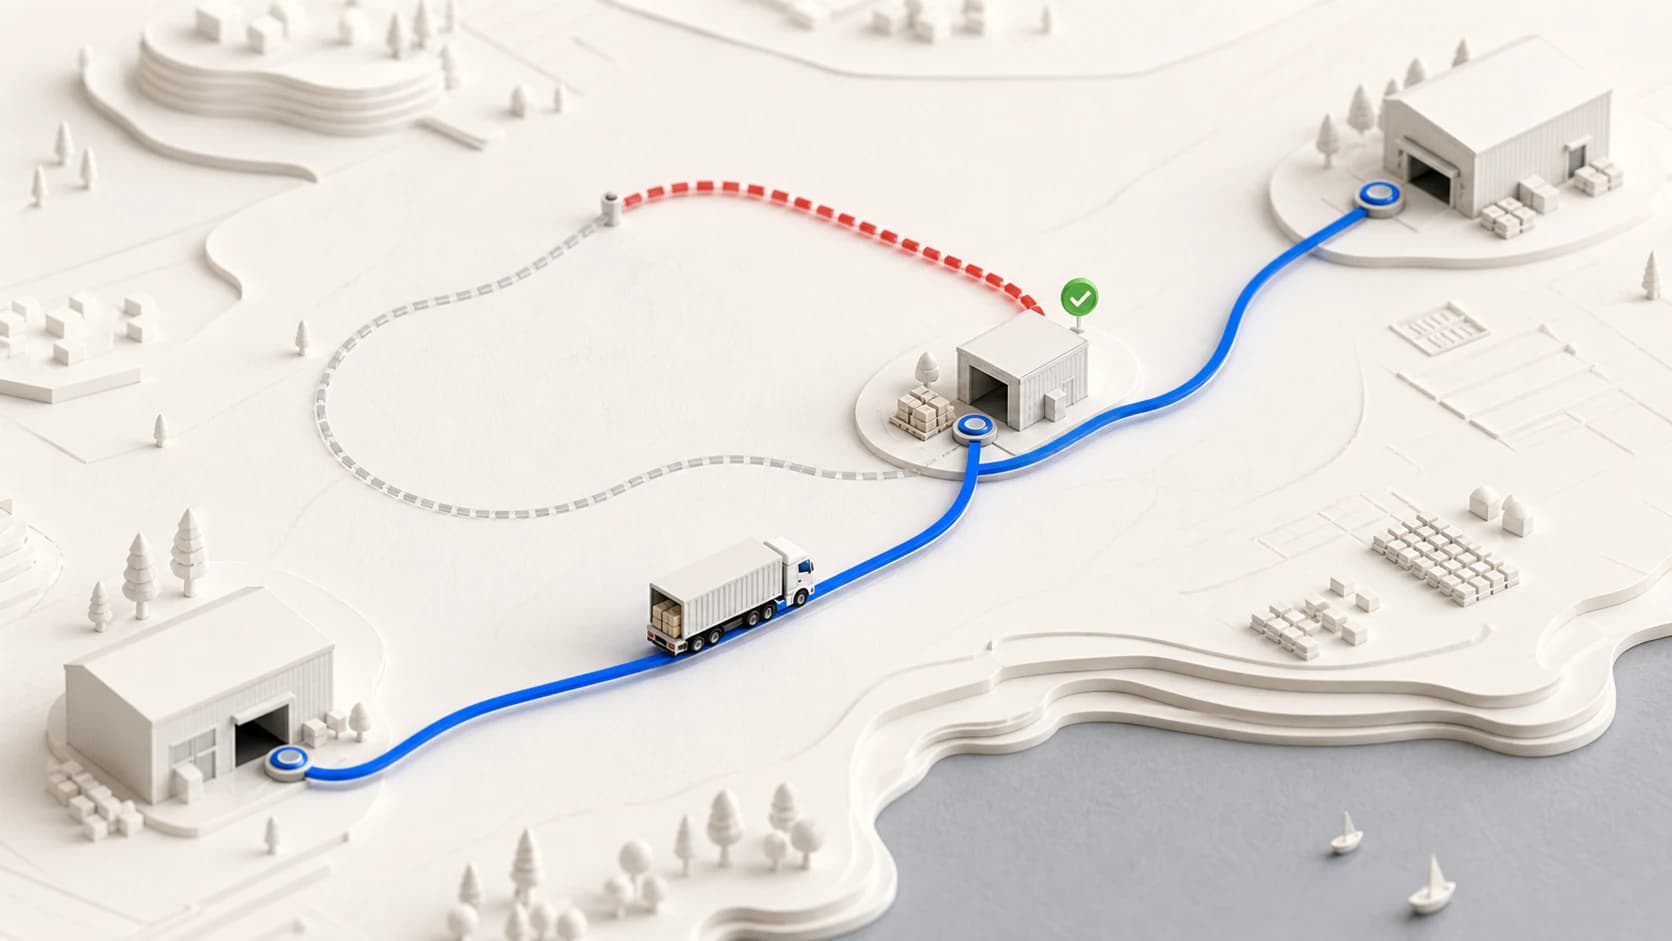
A fleet's average empty-miles ratio is misleading: the average can look healthy while individual trucks run at several times that figure. When two trucks working the same lane show different ratios, the problem is not the route but the jobs each truck is given. An operation that does not track the ratio per vehicle cannot know which vehicle actually earns.
Empty miles are the distance a truck covers with no load on board: driving empty to a pickup point, moving empty between two loads, and returning empty when no return load is found. Loaded kilometres earn the freight rate; empty kilometres only create cost — fuel, driver time, tolls and wear, with not a cent of revenue on top.
Seen trip by trip, empty miles look harmless. Spread across the fleet's total mileage at the end of the month, they turn into a number that is hard to ignore. Yet many operations never measure them, because trips are closed with the question "what did it earn?" instead of "loaded or empty?". This article covers how the empty-miles ratio is calculated, why empty running happens, and which methods bring it down in a real operation.
How is the empty-miles ratio calculated?
To keep loaded and empty kilometres in separate columns of the same file, download the freight tracking Excel template. It works out the empty-km ratio, the total cost from the lines you enter and the trip profit left over from the freight charge. Put the fuel and other costs of running empty into the relevant cost columns as well.
The empty-miles ratio shows what share of a truck's or a fleet's total mileage is driven with no load. The formula needs two numbers:
Empty miles ratio (%) = (Empty miles driven ÷ Total miles driven) × 100
Example: a truck driving 10,000 km in a month, 2,500 km of it empty, has a ratio of (2,500 ÷ 10,000) × 100 = 25% (example figures). Twenty-five percent says one of every four kilometres this truck drove earned nothing. The inverse, the loaded-miles ratio, is simply 100 minus the empty ratio; together the two figures summarise how much of the truck's mileage actually produced revenue.
What you manage is the ratio, not the raw kilometres. Absolute mileage grows with the volume of work: empty kilometres rising while the fleet grows is natural, and easy to mistake for bad management. The ratio cancels out that growth — it compares empty running against the work done, which makes trucks comparable to trucks and months to months. The ratio can improve while total empty kilometres rise, and it can worsen while total mileage shrinks in a downturn. The goal is therefore not fewer kilometres but the same work with fewer empty kilometres.
The empty-miles ratio is the efficiency gauge of every kilometre. Two fleets can cover the same total mileage and earn very different profits; a large share of that difference hides in how much of the mileage ran loaded. An operation that does not know its ratio cannot know which part of the fleet is actually earning.
The ratio can only be calculated if the records split loaded from empty kilometres. Seferi Analytics reports each vehicle's loaded and empty mileage separately and shows the ratio by fleet, vehicle and lane, so the average never hides what individual trucks are doing. If you have your own records at hand, enter the total and empty kilometres of a truck or the fleet into the calculator on this page; it works out the ratio for you.
Why does empty mileage happen?
Empty kilometres are rarely the result of one bad decision. They come from five separate points where a decision never gets made. These are the five causes that repeat most often in the field.
No return load is found. When the truck reaches the delivery point and nothing waits in the return region, it drives home empty. This is the largest source of empty miles in most operations: every one-way job with no thought given to the return is only half a job, carrying a hidden cost inside the outbound rate.
Wrong vehicle positioning. When the plan does not know which trucks free up in which region at which hour, it assigns the vehicle that looks most convenient rather than the one closest to the job, and the truck drives to the pickup from far away, empty. When position data is not kept current, this mistake repeats quietly every day.
Poor load-to-truck matching. The vehicle sent does not fit the load's weight, volume or type: a large truck is sent on a small load, capacity runs out early, and a second truck rolls out the same day for the rest of the job. A second dispatch means a second empty approach.
Jobs in the same region are given to separate trucks. Two jobs starting the same day in the same area could share one route, but two trucks are sent, so one drives empty to its pickup point and the other arrives empty from the opposite direction. Without region-based combining, empty miles grow with the number of jobs.
Timing of planning. When a job arrives at the last minute there is no time left to choose the right vehicle or build the route; the truck that happens to be ready is assigned to the job that happens to start earliest, not to the one it is closest to. The cost of the rushed decision is invisible during the day and comes back as empty mileage at the end of the month.
| Why it happens | How it shows up in the field | Which remedy addresses it |
|---|---|---|
| No return load is found | The truck drives home empty after delivery | Backhaul approach |
| Wrong vehicle positioning | The truck drives empty from far away to the pickup | Load-to-truck matching |
| Poor load-to-truck matching | Capacity runs out early, a second dispatch is born | Load-to-truck matching |
| Regional jobs go to separate trucks | Two trucks roll out for two jobs | Consolidation |
| Planning timing | The job arrives last-minute, a truck sits ready | Planning discipline |
The five rows in the table summarise five separate scenarios. When no return load is found, the truck drives home empty after delivery and the answer is a backhaul approach. When vehicle positions are wrong, the truck approaches the pickup empty from a distance; that is a load-to-truck matching problem. When the wrong truck is picked for the load, capacity runs out early and a second dispatch is born — matching again. When regional jobs are handed to separate trucks, two trucks roll out for two jobs; consolidation fixes that. When jobs arrive at the last minute, trucks sit ready while assignments are rushed; the remedy is planning discipline.
Empty miles are usually not the result of a deliberate decision but of running out of time to make one. Through the day, the question "which truck is ready, which job is urgent?" crowds out the question "how much empty mileage does this job add?". The same operation sees its ratio drop in the weeks it finds time to plan properly — that is no coincidence.
How do you reduce the empty-miles ratio?
There are five methods, one for each of the causes above. The table shows which remedy closes which cause; each method works as follows.
Work a backhaul approach. Turning one-way jobs into two-way jobs eliminates empty miles at the source. Before the truck reaches its delivery point, loads in the return region are checked, and the trip is planned with an outbound and a return load linked to each other. On lanes where no return load exists, the empty return has to enter the price deliberately instead of being left out; we covered how that works in how freight rates are calculated.
Build multi-stop routes. A second pickup near the delivery point can be added to the main route as an extra stop; the truck carries two jobs in one outing, and the connecting kilometres run loaded instead of empty. Getting the stop order and the corridor right is the backbone of this method; we covered how machines build these routes in AI-based route optimisation.
Leave load-to-truck matching to the calculation. The right answer to "which truck takes this job?" hides in four facts: the truck's capacity, its type, its position and the hour it frees up. Putting those on top of each other in one head cannot compete with letting the calculation match every job to the nearest suitable truck. Seferi Optima distributes orders across vehicles while taking empty miles into account, and hands the result back as a plan: how many trucks, in what order, carrying which jobs.
Make consolidation a rule. Jobs starting in the same region on the same day should be combined on one truck as a standing rule, not distributed one by one as they arrive; the plan includes a daily region-level combining step. Consolidation reduces not only empty miles but also the number of trucks on the road.
Build planning discipline. Job acceptance gains the question "where does this job pick up this truck from, and where does it leave it?", loading windows are agreed with customers in advance, and the hours trucks free up are known a day ahead rather than discovered during the day. Last-minute jobs get a standing rule too: under which conditions, which truck, at which extra cost.
When a return load is suggested at the moment of assignment, empty kilometres stop being a number you report after the fact. They show up while the plan is still being made.
Try it with your own backhaulsHow does a lower ratio show up in profit?
Empty miles are a separate line inside the trip's cost: they consume fuel, driver time and wear, and return no freight rate in exchange. How that line enters the trip cost and adds up with the other items is covered in how to calculate transport costs. The real effect of the ratio shows per vehicle: a truck running a high empty ratio is a truck that covers plenty of kilometres and earns little, and the fleet average hides exactly that distinction. We covered how the ratio shapes per-vehicle profit in profit per truck.
Example calculation (example figures): a truck covering 12,000 km a month with a 25% empty ratio runs 3,000 km empty. If the ratio drops to 20%, the same volume of work is done with 2,400 empty kilometres — 600 km of fuel, driver time and hours are recovered without giving up a single job. The point to keep in mind: the improvement comes from doing the same work with fewer empty kilometres, not from driving fewer kilometres overall.
Zero empty miles is not the goal. Trucks must return home, go in for maintenance and reposition to new regions, and part of that running will always be empty. What is risky is not the empty miles you planned for; it is the empty mileage that never entered the plan. Chasing a zero ratio stalls the operation; managing the ratio deliberately makes it efficient.
Where does the improvement start?
Managing empty miles is built in four steps, and the first one is measurement. None of the methods above can be applied to a fleet whose ratio is unknown.
- Measure first. Split every truck's monthly mileage into total and empty, and work out the ratio per truck. Individual trucks decide the action, not the fleet average.
- Start with the highest ratios. Look at the last month of the truck with the highest ratio: which jobs produced empty kilometres, and where could they have been combined? Most of the time the problem is not the route but the jobs that were given to that truck.
- Apply the remedy that matches the cause. If empty returns dominate, work the backhaul; if empty approaches to pickups dominate, work matching and consolidation; if time pressure dominates, work planning discipline.
- Re-measure monthly. Recalculate the ratio in the same breakdown and compare it with the previous month. A lasting improvement on an individual truck shows up within two or three months; an operation that stops tracking the ratio quietly gives the gains back.
The empty-miles ratio works at any fleet size: it is calculated with the same formula and reduced with the same methods in a one-truck operation and in a fleet of a hundred. What makes the difference is that loaded and empty kilometres are recorded, and that the ratio is tracked per vehicle.
Have your fleet's loaded and empty mileage separated on a single screen, with the empty-miles ratio ready per truck.
Try 14 days freeCalculate your empty-km ratio
Enter total and empty kilometres from your own records. The tool only calculates with the values you enter; it contains no sample data.
Enter the total kilometres — the ratio appears here as you type.
Frequently asked questions
What is a good empty miles ratio?
There is no single target that applies across the industry; the ratio depends on the type of work, the lanes and how the fleet is structured. A fleet running regular two-way lanes and a fleet taking mostly one-way jobs will not settle on the same figure. The practical method is to track the ratio against your own history first: line up each truck's monthly ratio, compare trucks on the same lane, and question any truck that climbs or clearly drifts away from its peers. Worry about a ratio that stays high month after month, not about a single bad month.
Are empty miles and deadhead miles the same thing?
In everyday trucking use the terms overlap: both describe kilometres driven with no revenue cargo on board. That covers driving empty to the pickup point, moving empty between two loads, and returning empty when no backhaul is found. The one term that names a narrower case is the empty return, which is specifically the return leg of a one-way job. The distinction matters for management: the empty return is reduced by finding a backhaul, while empty repositioning to a pickup is reduced by load matching and planning.
Where does the empty miles ratio come from?
The ratio is calculated from records that separate loaded and empty kilometres. Planned empty miles come from the trip plan: if the vehicle has to drive to a pickup with no load, that distance is empty. Actual empty miles are verified against GPS data, and the gap between the two reveals empty kilometres that never entered the plan. If a fleet records its trips without a loaded/empty split, the ratio simply cannot be calculated; the first step is to add loaded and empty kilometre fields to the trip close-out.
How do carriers find backhaul loads?
Backhaul comes from three sources: load boards and freight exchanges, reverse-lane shipments from existing customers, and framework agreements on lanes you work regularly. Searching the return region's listings before the vehicle reaches the delivery point is far more effective than searching after it sits empty; empty mileage disappears when the return load is secured before delivery. On lanes where no return load exists, the return cost must be priced into the quote deliberately instead of being left out.
Sources and references
- TurkStat (TÜİK) — road freight transport statistics
- Eurostat — road freight transport statistics (empty running)
- Ministry of Transport and Infrastructure — road transport rules
- UND — international road transport sector reports
- UTIKAD — logistics sector publications and glossary
- Inter-city distance chart — General Directorate of Highways (KGM)
This article is for general information; consult the relevant authority or your accountant for binding interpretation.