
03
Trip Log
One row per trip. You fill the white cells; the six columns with a blue header are formulas and calculate themselves.
Excel template
A spreadsheet that works out profit per trip, cost per kilometre and the empty-kilometre ratio on its own. Download it without signing up.
No sign-up, no email. The file downloads directly.
The same trip, two ways of working.
seferi-freight-tracking-template.xlsx
.xlsxColumns with a blue header are formulas; they fill themselves. Rows arrive empty.
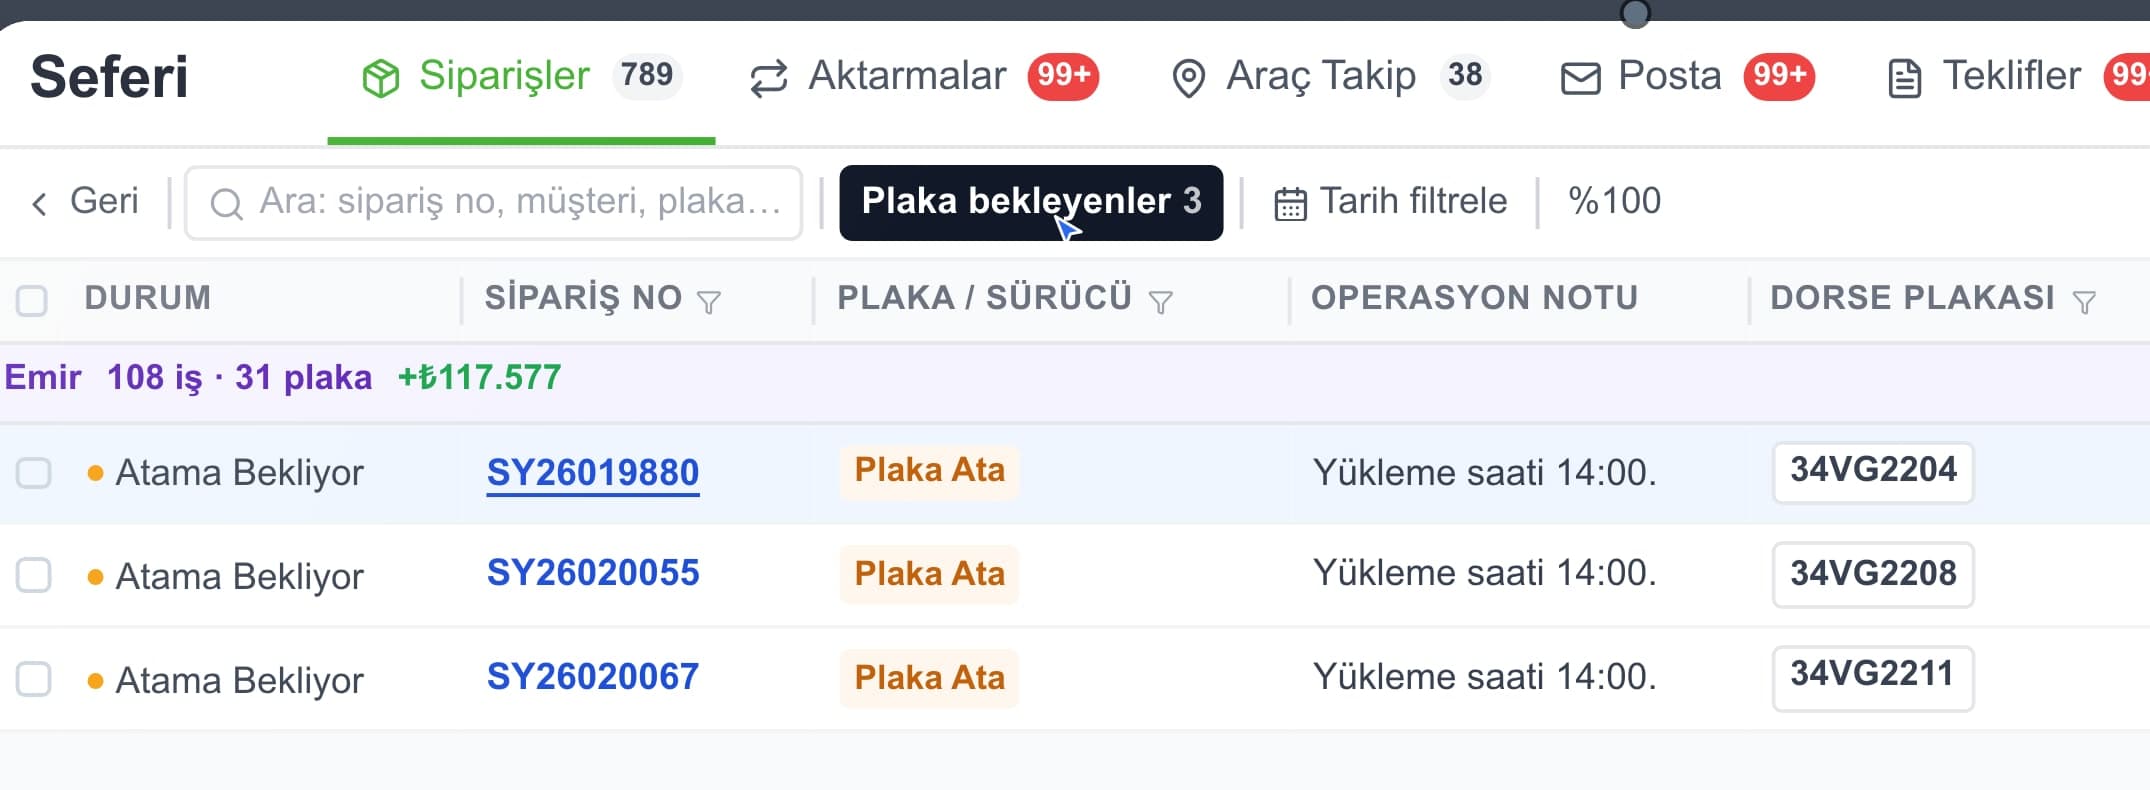
The same trip — plate, cost and profit on one row, shared with your team.
No need to recreate your orders one by one.
This job in Seferi
From the product film · narrated in Turkish, with captions
The only thing you enter is trip rows; the other two sheets fill themselves.
One row per trip. You fill the white cells; the six columns with a blue header are formulas and calculate themselves.
Total freight, total cost, profit, average margin, total empty kilometres and average cost per kilometre. You enter nothing.
Which columns are formulas, why empty kilometres are kept separate, and what cost per kilometre is for.
Most templates record the trip but never work out the profit. The last group is what makes the difference: without the cost lines kept separately, profit per trip cannot come out.
Trip
Distance
Money
Calculated for you
Empty kilometres get their own column on purpose. Kept together with loaded kilometres, a trip looks profitable while the fleet ends the month unprofitable — only the split shows the gap.
You have seen the columns. The file itself is one click away — no sign-up, no email.
You do not have to give up Excel. For an operation starting with one vehicle a spreadsheet is faster than most software: you add a column, change a formula, ask nobody's permission. This template was built for exactly that.
Where Excel stops is not the arithmetic but concurrency. The moment two people write to the same file, versions diverge; what the driver knows in the field only reaches the sheet when somebody carries it there by hand; and to see your current cost while quoting you have to open another file. As trips add up, what is lost is not accuracy but timeliness.
The second limit is reporting to authorities. While the trip sits in a spreadsheet the regulatory notification is filed on a separate screen; the two records drift apart over time, and most missed filings come from exactly that drift.
From spreadsheet to trip tracking
Track the freight charge and expenses from your spreadsheet against the same trip in Seferi. See what each job leaves you.
The first 14 days are free; no card needed to sign up.
 Illustrative data
Trip profitability · sample view
Istanbul → Ankara
SAMPLE-001 · Owned vehicle
Costs for this trip
Calculated from recorded costs. Missing expenses change the profit shown.
Enter each trip’s freight charge, fuel, tolls, driver, maintenance and other costs on one row. The formula columns calculate total cost, trip profit and margin.
Trip profit = Freight charge − Total cost
28,000 TL − 20,000 TL = 8,000 TL
Margin is profit divided by the freight charge. Amounts exclude VAT. Include empty-mileage expenses in the relevant cost lines and allocated overhead in “Other costs”. Trip profit is not your business’s after-tax net profit.
The same calculation in the template
| Field | In this example |
|---|---|
| Freight charge · K2 | 28,000 TL |
| Total cost · Q2 | 20,000 TL |
| Trip profit · R2 | 8,000 TL |
| Margin · S2 | 28.6% |
What breaks dispatch planning in Excel isn't the spreadsheet — it's two people filling the same one with different decisions at the same time.
02Freight cost is not the price quoted to the shipper; it is the sum of the ten cost items a carrier covers to make a trip happen.
03The empty-miles ratio is a fleet's invisible cost: here is the formula, why empty running happens and how operations cut it down.
04The vehicle is what earns, not any single trip: the full per-truck chain from revenue to net profit, item by item, with a worked monthly example.
05Excel is the right tool at small scale; the problem is never the file itself, but what happens once more than one person writes into it.
Shift hours, shifts that run past midnight and the total per driver.
Which load is on which vehicle, the fill rate, shipment status, and dispatches with no vehicle yet.
The quote document you send a customer — it also asks what the price includes.
Levels three carriers onto one basis: not the headline rate but a comparable total with excluded items added.
What people ask most before downloading.
Straight from the link on this page. You do not need to sign up or leave an email address. The file is .xlsx and opens in Excel, LibreOffice Calc and Google Sheets. It contains three sheets: the trip log, a summary and usage notes.
Trip details (trip no, date, customer, collection, delivery, plate, driver), distance (loaded km, empty km, total km), money lines (freight, fuel, tolls, driver cost, maintenance and depreciation, other) and six calculated columns: total km, total cost, profit, margin, cost per km and empty km ratio.
The formulas are filled in for 200 rows, one row per trip. If you need more, copy the last row downwards and the formulas carry on. The sheet count does not change: trip log, summary and how to use.
Empty kilometres produce no revenue but they do produce fuel, wear and driver hours. Kept in the same column as loaded kilometres, individual trips look profitable while the fleet ends the month unprofitable. A separate column puts the ratio on the summary sheet; the lower it is, the more of the same total distance is earning.
Not because of the arithmetic, but because of concurrency. When more than one person writes to the same file, when field information has to be carried into the sheet by hand, and when you start opening another file to find your current cost while quoting, you have reached Excel's limit. As trips add up, what is lost is not accuracy but timeliness.
Calculators, Excel templates and reference tables in one place.
All free resourcesRun the same trip on one record with your team: request, quote, order and trip all move in the same place. The costs you enter feed into trip profit.