

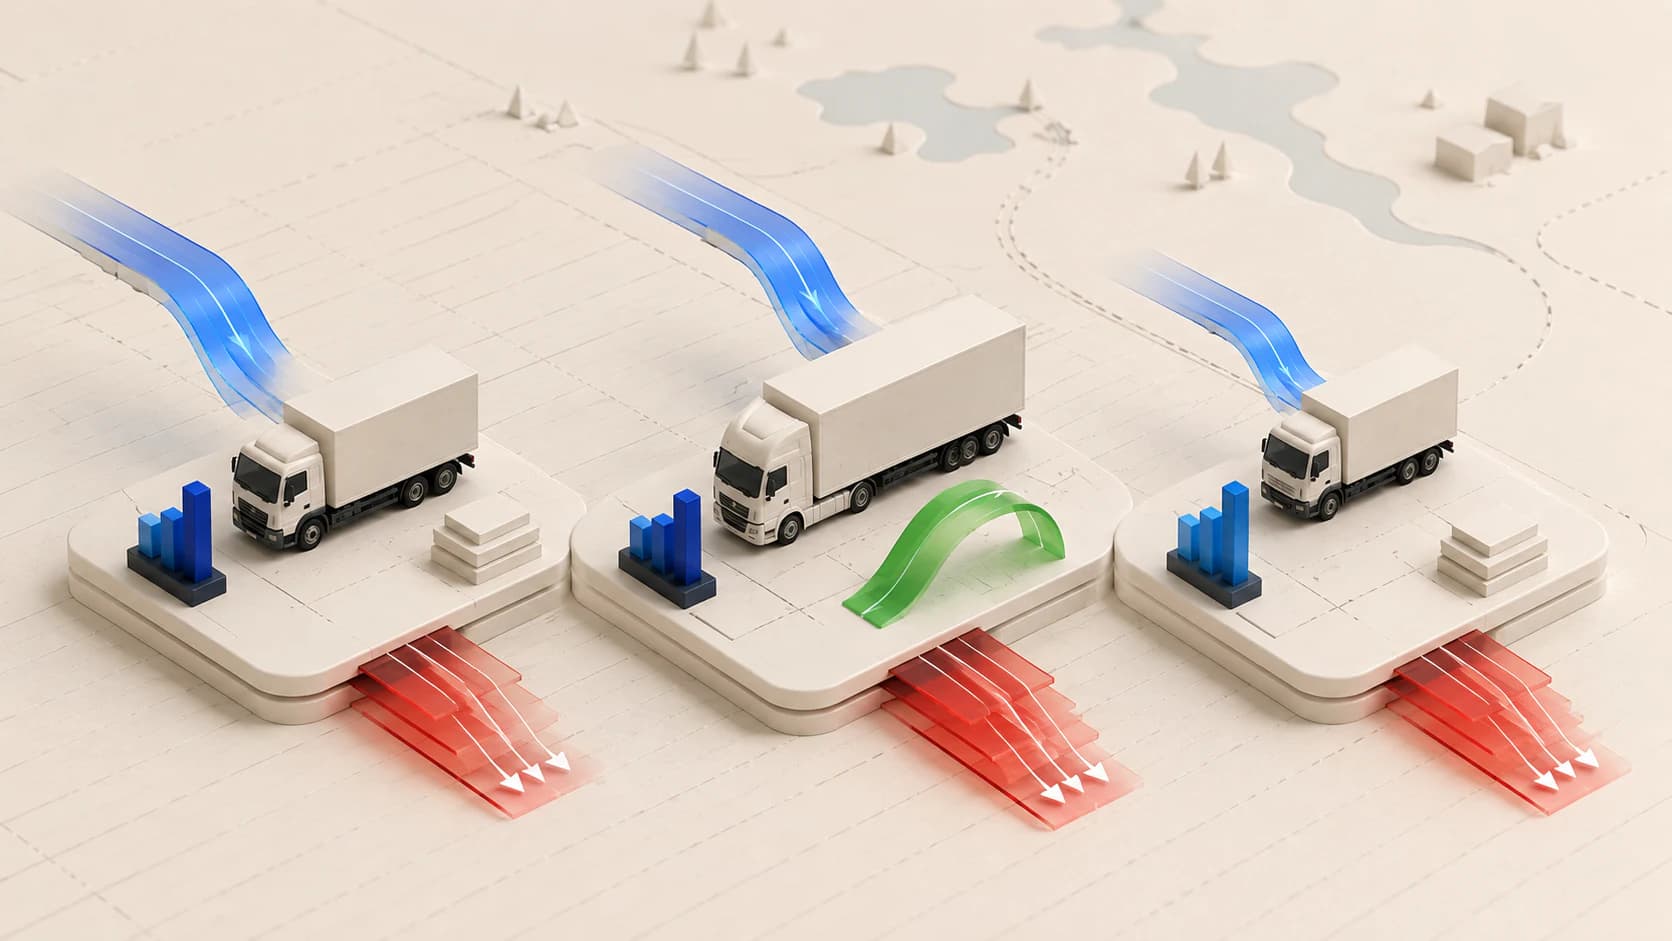
A trip report can never show the cost of the days a vehicle sits idle: those days burn no fuel, but depreciation, insurance and the driver's wage keep running. Truck profit closes all of the month's trips and its empty days into one number — the only number that says which vehicle in the fleet is actually earning.
Which truck actually makes money? The more vehicles you run, the more expensive that question becomes — and most carriers look for the answer in trip-level reports: which trip paid well, which lane lost money. But the vehicle is what earns, not the trip, and a trip report never shows what the truck cost during the days it sat between jobs.
This article builds the profitability of a single vehicle end to end: how revenue is booked to the truck, how each of the eight cost items is recorded per vehicle, and how net profit is closed at the end of the month. A worked monthly example follows below.
Trip profit and truck profit are not the same number. Trip profit subtracts one job's direct costs from one job's invoice. Truck profit is the combined result of every trip in the month and of the days the vehicle spent idle — days that burn no fuel but still carry depreciation, insurance and the driver's wage. None of that ever shows up in a trip-level report.
The profit-per-truck chain: from revenue to net profit
The profitability of a single truck reads off a single chain:
Trip revenue − Fuel − Tolls − Driver − Per diem − Maintenance − Tyres − Depreciation − Empty-kilometre share = Truck net profit
How each of these items enters a trip price is covered line by line in how to calculate transport costs; here the question is how each item is recorded against the truck. The order does not matter. What matters is that all eight records meet on the same vehicle in the same period.
- Trip revenue. The amount on the invoice issued for the job, booked to the vehicle that carried it out. When one job is executed with more than one vehicle — an interline move, for instance — the amount is split across them; otherwise the full revenue makes one truck look profitable and the truck that actually hauled the load look empty. How the price is built in the first place is covered in freight rate calculation, and which details the invoice must carry in how to issue a transport invoice.
- Fuel. Fuel receipts are booked to the plate. The period consumption comes from the total of the receipts, adjusted for the fuel level in the tank at the start and end of the period. A receipt booked to the wrong vehicle distorts that truck's profit as much as its fuel line.
- Tolls. The HGS system is tied to the plate, so the motorway and bridge crossing statement arrives per vehicle by itself. A route change simply makes this item larger on the same truck's next trip.
- Driver. With a driver permanently assigned, the full monthly wage goes to that vehicle. With rotating drivers, the wage is split in proportion to the days each driver spent on each vehicle. Treat the wage as independent of the vehicle and the fleet's single largest cost never lands on any truck's books.
- Per diem. Paid per day on the road; multiplied by the trip's days and booked to that trip's vehicle. Days spent waiting belong to the same item — while the truck waits for a load, the driver's per diem keeps accruing.
- Maintenance. Workshop invoices are issued to the plate and booked straight to the vehicle. Spreading scheduled maintenance into a monthly provision, rather than letting one invoice land on a single month, keeps profit readable across months.
- Tyres. Buying a set of tyres is not an expense of the month of purchase; a tyre set's life is measured in kilometres. Multiply the vehicle's monthly kilometres by the per-kilometre wear share and book that amount to the month.
- Depreciation. The vehicle's loss of value spread over its economic life: the difference between the purchase value and the expected residual value, divided by the life in months. It runs whether the truck runs or not, which makes it the first item that separates truck profit from trip profit.
- Empty-kilometre share. The fuel, toll and driver cost of the kilometres the vehicle covered without a load. Every trip that finds no return load enlarges this item; how the share is measured is covered in how to calculate empty kilometres.
Why measure per truck rather than per trip?
A trip report measures the job; a truck report measures the truck. That distinction is the core of fleet profitability, because a vehicle is more than the trips it completes in a month. Between trips the same truck waits for load, goes in for maintenance, and comes back empty when no return load exists — and it keeps generating cost through all of those days.
Make it concrete. A truck completes three trips in a month; on each, the invoice exceeds the trip's direct costs, so all three close as profitable. At the end of the month the same truck is in loss: four days waiting for a load between two trips, a corridor driven empty because no backload could be found, and a scheduled maintenance invoice that arrived that month. None of it belongs to a single trip. All of it belongs to the vehicle.
Truck profit is therefore not the sum of trip profits; it is the result of all of the month's trips combined with the vehicle's fixed costs and its idle-time costs. Revenue is born with a trip and ends with it. Cost is continuous: depreciation, insurance and a salaried driver run at the same pace whether the truck is loaded or parked. A trip that looks profitable on its own invoice is no evidence that the truck which carried it out is profitable.
A truck's month can end in loss while every single trip looked profitable. A trip-level report cannot show this, because it has nowhere to put idle days, empty returns or fixed costs. Trusting trip profit before the truck's month has been closed is mistaking turnover for profit.
Once the unit of measurement becomes the vehicle, the questions change: which trucks produce the fleet's profit, which ones do not even cover their own depreciation, which lane suits which truck, where does the driver-vehicle pairing lose money? Two trucks of the same model on the same lane can produce very different results because of driving habits and maintenance history — and seeing that requires the data to break down by vehicle.
Worked example: one truck's month
The first step in this monthly calculation is collecting trip revenue and costs consistently. With the freight tracking Excel template you can record each trip on one row and read through the worked example of trip profit. The template totals the trips; the fixed costs of the days a truck stands idle still have to enter the monthly vehicle calculation separately.
Let us apply the method to a single truck for a single month. In the example the vehicle completes six trips; four of them return loaded, two return empty. The figures below are a worked example created to show the calculation method; they are not market data. Put your own fleet's numbers into the lines and the mechanics stay the same.
| Item | Amount (TL) | How it is determined |
|---|---|---|
| Trip revenue | 480,000 | Invoices of six completed trips |
| Fuel | 165,000 | Plate-level receipts, adjusted for tank levels |
| Tolls and crossings | 39,000 | HGS motorway and bridge crossings on the plate |
| Driver | 48,000 | Monthly wage of the assigned driver |
| Per diem | 16,500 | Days on the road × daily rate |
| Maintenance | 18,000 | Scheduled maintenance and repair invoices |
| Tyres | 9,000 | Monthly kilometres × per-kilometre wear share |
| Depreciation | 22,500 | The month's share of value loss |
| Empty-kilometre share | 12,000 | Variable cost of the kilometres run without load |
| Total costs | 330,000 | The sum of the eight items |
| Truck net profit | 150,000 | Trip revenue − total costs |
Let us read the month row by row. The truck completed six trips and the invoices produced 480,000 TL of revenue in total. Out of that revenue, 165,000 TL went to fuel and 39,000 TL to HGS motorway and bridge crossings. The truck went through one scheduled maintenance and a small repair, with workshop invoices of 18,000 TL. The assigned driver's monthly wage was 48,000 TL and the per diem for the days on the road came to 16,500 TL. No tyres were bought this month, yet the wear share provisioned per kilometre reached 9,000 TL, and the depreciation share was 22,500 TL. Two return legs ran empty, and the fuel, toll and driver cost of those empty kilometres came to 12,000 TL. The eight items add up to 330,000 TL. Subtracted from revenue, they leave 150,000 TL of net profit.
Viewed per trip, each of the six jobs would look as if it had covered its own fuel, tolls and driver share. Because the two empty returns cannot be allocated to any single trip and depreciation is never written onto a trip, the sum of the trip profits would look better than the truck's real result of 150,000 TL. The bottom row of the table closes that gap.
Is profit measured the same way for an owned and a contracted vehicle?
An owned (özmal) vehicle's profit is built the way shown above: fuel, tolls, driver, maintenance, tyres, depreciation and the empty-kilometre share are all subtracted from revenue. None of those lines exist on your books for a contracted (sözleşmeli) or subcontracted vehicle — you don't own it, so the subcontractor carries its depreciation and tyres.
A contracted vehicle's profit comes from one subtraction: trip revenue minus what you paid the subcontractor. There's no eight-line table to build, the margin shows up instantly. In exchange, the asset value that accumulates in an owned truck never accrues on the contracted side.
Don't place the two margins side by side without adjustment. An owned vehicle's net profit already has depreciation — a non-cash item — subtracted from it; a contracted vehicle's margin never had one to begin with. If you want to compare them, calculate the owned vehicle's cash profit (excluding depreciation) separately and compare that instead.
Where this calculation lives: records and reporting
For the chain to work, all nine records must meet under the same plate. Revenue is booked to the truck when the trip opens and is replaced by the real amount when the invoice is issued. The fuel receipt and the toll statement land the day they happen; the maintenance invoice lands the day the workshop hands it over. When records flow together with the trips, closing the month is an act of reading, not of adding up.
When the records have no common home, the calculation becomes a manual gathering exercise once a month. Closing a truck's month in Excel is possible; where that breaks down over time is covered in where transport tracking in Excel breaks down.
In Seferi, revenue and cost records accumulate under the same vehicle together with its trips. The Seferi Reporting screen holds period revenue, total cost and profit or loss in three separate cards, and the performance board sorts its rows by person or by vehicle. On the vehicle's row, its loaded and empty kilometres, the profit or loss of its trips and its profit rate sit together — the profit-rate column measures efficiency, not turnover. When a job fails to enter the profit calculation, the reason is written on its row: no plate assigned, or price or cost never entered. The same screen exports to Excel in exactly the layout shown.
When revenue, fuel, tolls and maintenance all sit under the plate, net profit per vehicle is read straight off the report. Nobody has to merge spreadsheets at month end.
Try it with your own fleetWhat the net profit is for: from closing to decisions
A monthly net profit is not a decision number on its own; comparisons give it meaning. This month's result should be read on the same row as last month's and the same month a year ago. A month that carries the weight of a maintenance invoice should be judged without staining the report of the month that follows it.
Still, measuring profitability sets direction. The depreciation line gives the reason to replace a vehicle that has reached the end of its economic life, or to sell it. A truck whose empty-kilometre share stays high moves to a lane where return loads exist. Whether a lane runs on owned vehicles or subcontractor vehicles is a fleet composition decision — and all of these decisions are made on the numbers of the vehicle's month, not on the numbers of individual trips.
Close the truck's month on a single screen. Once revenue, fuel, tolls and workshop invoices accumulate under the plate, net profit is not calculated by hand — it is visible.
Try 14 days freeFrequently asked questions
What is profit per truck?
Profit per truck is the profit a single vehicle generates over a fixed period, normally a month, once every revenue and cost attached to that vehicle has been netted off. Revenue means the freight invoices of every trip the vehicle completed in the period. Costs mean fuel, tolls, the driver, per diem, maintenance, tyres, depreciation and the share of empty kilometres. What separates truck profit from trip profit is the cost that runs whether the vehicle moves or not: depreciation, insurance and a salaried driver keep accumulating while the truck waits for its next load. Calculated vehicle by vehicle over the same period, the figure shows which vehicles earn and which quietly burn the fleet's profit.
How do you calculate a truck's operating cost per kilometre?
Take every cost of running the vehicle in a period and divide it by the kilometres the vehicle covered in that same period. Fuel, tolls and the wear-based shares such as tyres change with the kilometres driven, so they sit naturally in the numerator; depreciation and insurance are time-based and are usually allocated by the month instead. The denominator must be the real distance recorded for that vehicle, including its empty kilometres, because a distance read from the job list rather than from the odometer makes the cost per kilometre look better than it is. The same formula applied to every vehicle on the same monthly basis lets you compare vehicles of different ages and types without comparing one-off invoices.
Should depreciation be included when measuring truck profitability?
Yes. Leave depreciation out and the vehicle looks profitable while its own replacement is never paid for. Depreciation is the vehicle's loss of value spread over its expected economic life: the difference between the purchase value and the expected residual value, divided by the life in months. It is the first item that separates truck profit from trip profit, because it keeps running while the truck stands idle — a day with no trip still costs the vehicle a day of value loss. Fiscal depreciation rules may differ from this managerial view; the number that belongs in a per-truck profit calculation is the one that reflects the vehicle's real wearing out, not the tax calendar.
Sources and references
- EPDK — fuel price data
- General Directorate of Highways (KGM) — inter-city distance chart and toll tariffs
- Revenue Administration (GİB) — depreciation and useful-life rules
- Ministry of Transport and Infrastructure — road transport rules
This article is for general information; consult the relevant authority or your accountant for binding interpretation.